
Figure 7.
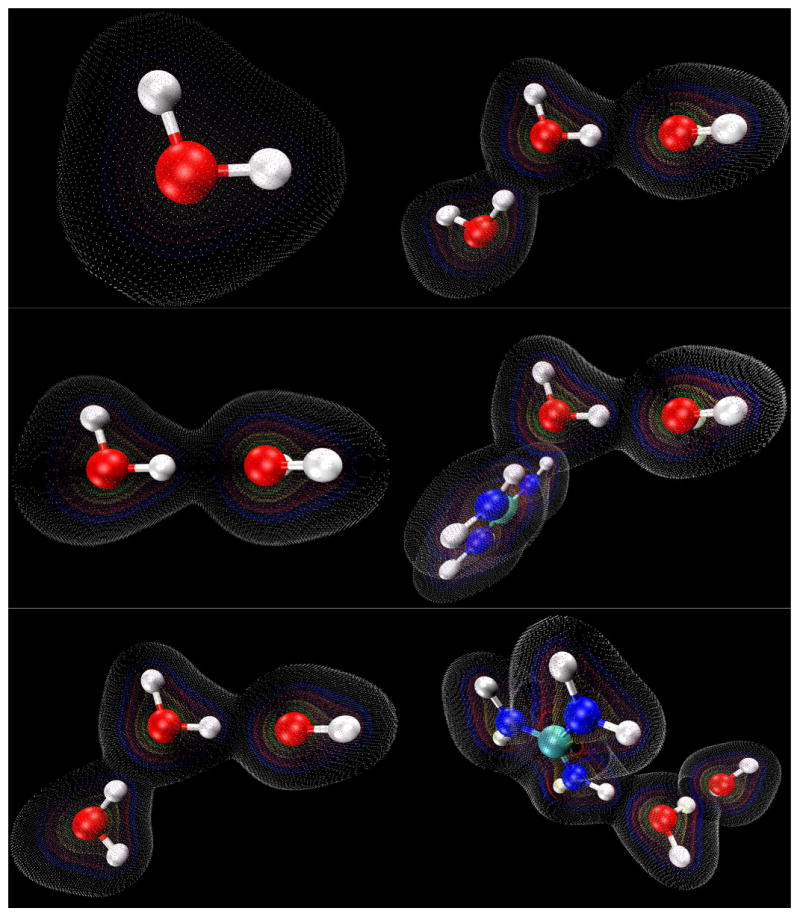
Electron density maps generated for the water monomer and linear molecular configurations using VMD 1.8.6. Contours are shown at values of 0.01 (white), 0.05 (blue), 0.10 (red), 0.25 (yellow), 0.50 (green).
Official websites use .gov
A
.gov website belongs to an official
government organization in the United States.
Secure .gov websites use HTTPS
A lock (
) or https:// means you've safely
connected to the .gov website. Share sensitive
information only on official, secure websites.
Electron density maps generated for the water monomer and linear molecular configurations using VMD 1.8.6. Contours are shown at values of 0.01 (white), 0.05 (blue), 0.10 (red), 0.25 (yellow), 0.50 (green).