
Table 1.
Hits and false positives obtained from the screening.
| Cpd Class | Cpd Name | Structure | % Inhib. (ThT)a | Sed. Assayb | % Inhib. (ThT) No DTT | Sed. Assay No DTT | IC50 (μM) |
|---|---|---|---|---|---|---|---|
| Antraquinones | 31G03 |  |
76 | ++ | 39 | - | 0.63 |
| Quinoxalines | 113F08 | 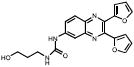 |
69 | ++ | 70 | +++ | 2.4 |
| 330B06 | 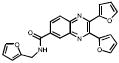 |
27 | +++ | 85 | ++ | 3.1 | |
| Pyrimidotriazines | 300C04 |  |
94 | +++ | 20 | - | 0.36 |
| Sulfonated Dyes | 6C06 | 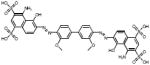 |
102 | +++ | 51 | - | 3.2 |
| Depsidones | 15B02 | 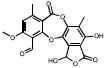 |
98 | +++ | 100 | +++ | 1.6 |
| Porphyrins | 06D04 | 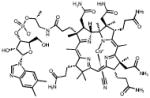 |
75 | +++ | -2.6 | nd | 4.5 |
| Phenothiazines | 30H07 | 100 | +++ | 99 | nd | 0.29 | |
| Benzofuran | 348E10 | 84 | +++ | 9.8 | nd | 0.61 |
a
Percentage inhibition of K18 fibrillization followed by ThT assay;
b
Sedimentation assay data: “+++” = 100% inhibition, “-“ = 0% inhibition, IC50 determined in the presence of DTT. Additional hits from the pyrimidotriazines, 17H03 and 93D02, behaved similarly to 300C04 and are not shown.