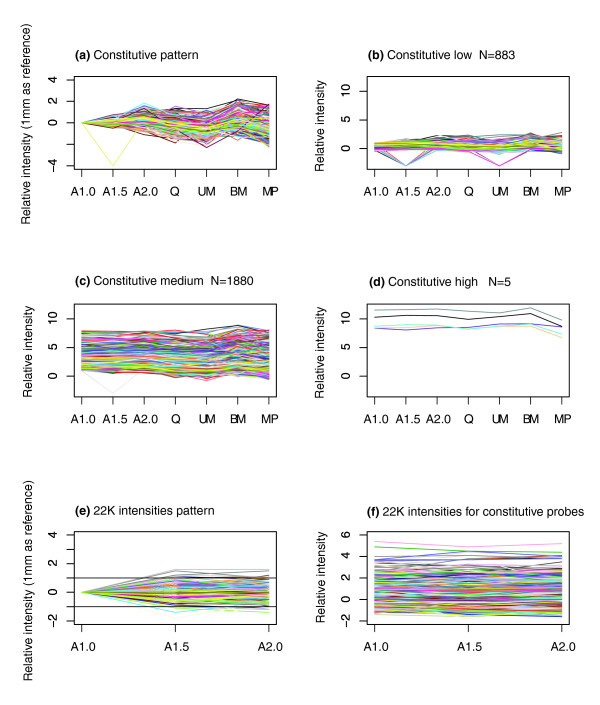
Figure 3.
Constitutively expressed transcripts based on k-means clustering. (a) Relative intensities adjusted by subtracting the value for the A1.0 stage. Constitutive transcripts grouped by the relative intensity values at the A1.0 stage: (b) below 1; (c) between 1 and 8; (d) over 8. Relative expression from a previous anther study on a 22 K Agilent array for probes expressed constitutively in this study is shown (e) relative to the A1.0 stage and (f) not adjusted for the A1.0 stage.

