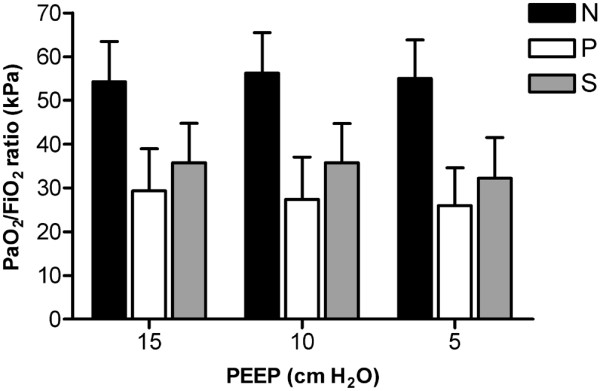
Figure 2.

Measured EELV as percentage of predicted sitting FRC at three PEEP levels. The black dotted line represent predicted sitting FRC (100%). Patients in group N had normal lungs, those in group P had a primary lung disorder, and those in group S had a secondary lung disorder. Values are expressed as mean ± standard deviation. EELV, end-expiratory lung volume; FiO2, inspired oxygen fraction; FRC, functional residual capacity; Pao2, arterial oxygen tension; PEEP, positive end-expiratory pressure.
