
Figure 3.
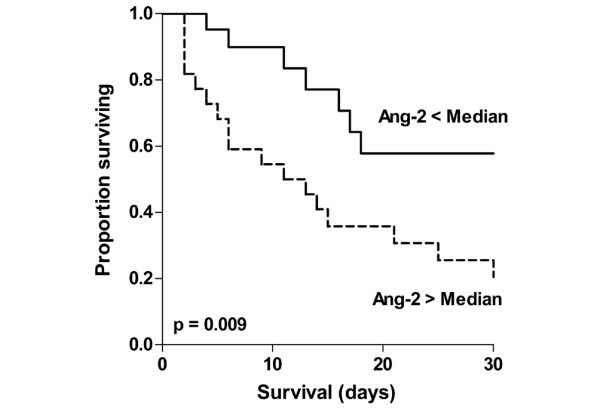
Kaplan-Meier curves of survival stratified to Angiopoietin (Ang) 2. (less versus greater than median; Log rank test p = 0.009).
Official websites use .gov
A
.gov website belongs to an official
government organization in the United States.
Secure .gov websites use HTTPS
A lock (
) or https:// means you've safely
connected to the .gov website. Share sensitive
information only on official, secure websites.
Kaplan-Meier curves of survival stratified to Angiopoietin (Ang) 2. (less versus greater than median; Log rank test p = 0.009).