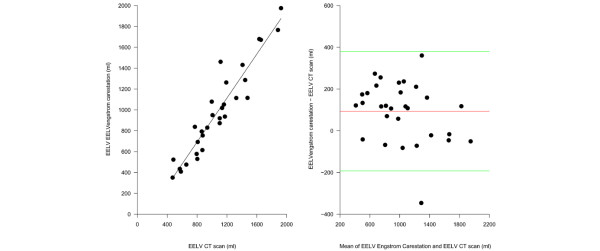
Figure 1.
Comparison of end expiratory lung volume (EELV) measured by the Engstrom Carestation and the computed tomography (CT) scan. (a)The EELV measured by the Engstrom Carestation as a function of the EELV measured by the computed tomography (CT) scan (EELV carestation = 242 + 0.85 × EELV CT scan, r2 = 0.89, p < 0.00001). (b) The Bland-Altman plot of the EELV measured with the CT scan and the EELV measured with the Engstrom Carestation. The x axis shows the mean of the two measurement and the the y axis shows the difference between the EELV measured by the Engstrom Carestation and the EELV measured by the CT scan (average difference 93 ± 143 ml, limits of agreement -50 – 236 ml).

