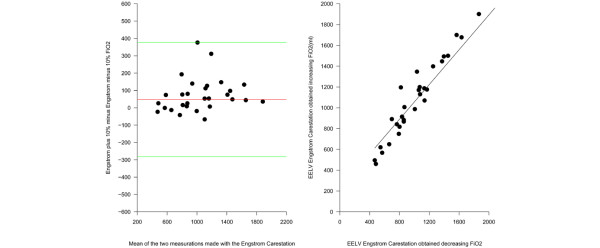
Figure 3.
Accuracy of the nitrogen washin/washout technique. (a) The relation between the EELV measured by increasing the FiO2 as a function of the EELV obtained decreasing FiO2. The EELV obtained increasing the FiO2 was -56 + 1.0078 multiplied by the EELV obtained decreasing the FiO2 (r2 = 0.84, p < 0.0001). (b) The Bland-Altman plot of the EELV measurement obtained increasing the FiO2and the EELV obtained decreasing the FiO2. The x axis shows the mean of the two measurements and the difference between the EELV measured by increasing FiO2 and the y axis shows the EELV obtained decreasing FiO2 (average difference 48 ± 165 ml, limits of agreement -117–213 ml).

