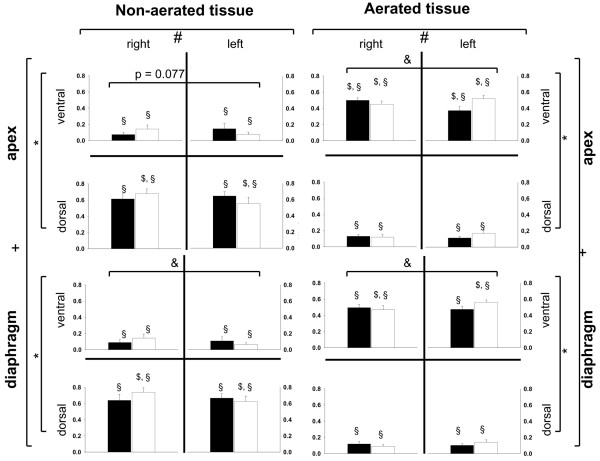
Figure 2.
Distribution of fractions of non-aerated and aerated tissue in end-expiratory spiral computed tomography scans. Filled bars indicate oleic acid-induced acute lung injury (ALI), and outlined bars indicate hydrochloric acid-induced ALI. Fractions of densities are presented as mean ± standard error of the mean. *P < 0.05: ventral versus dorsal, analysis of variance (ANOVA). +P < 0.05: interaction of ventral-dorsal and apical-diaphragmatic distribution, ANOVA. #P < 0.05: interaction injury and left-right distribution. &P < 0.05: left versus right in juxtadiaphragmatic regions for hydrochloric acid-induced ALI, Tukey's honest significant differences (HSD). §P < 0.05: apex versus diaphragm for corresponding region of interest (ROI), Tukey's HSD. $P < 0.05: left versus right for corresponding ROI, Tukey's HSD.

