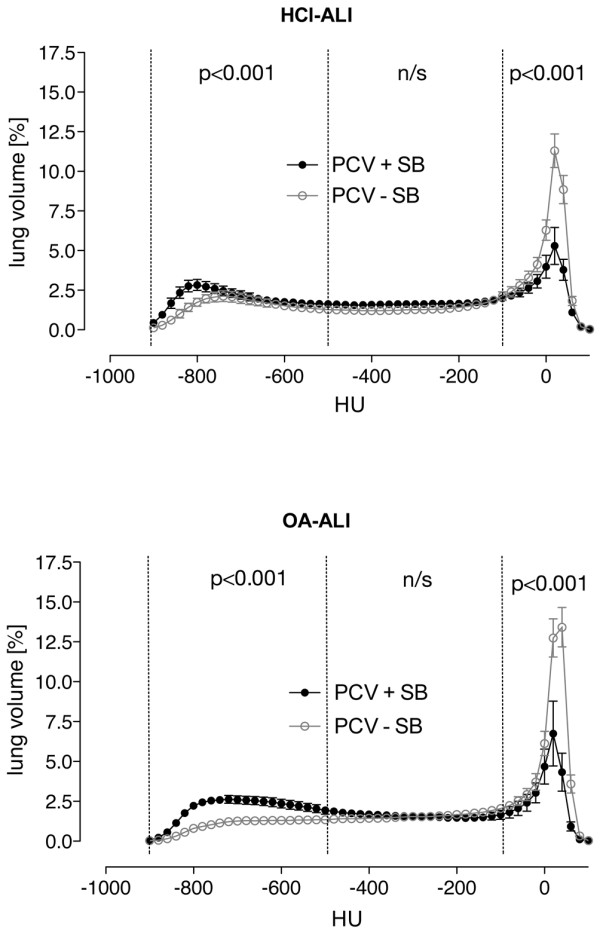
Figure 4.

Density distributions. Density histograms taken from end-expiratory spiral computed tomography of all animals show normalized lung volume in Hounsfield units (HU) ranging from -1,000 to 100 plotted as mean ± standard error of the mean. Aeration categories (hyperinflated, normally aerated, poorly aerated, and non-aerated) are marked and were statistically compared (see Results and Discussion sections of the text for details) between pressure-controlled ventilation with (PCV + SB) and without (PCV – SB) spontaneous breathing. There were no significant differences caused by the type of acute lung injury. HCl-ALI, hydrochloric acid-induced acute lung injury; n/s, not significant; OA-A.
