Figure 3.
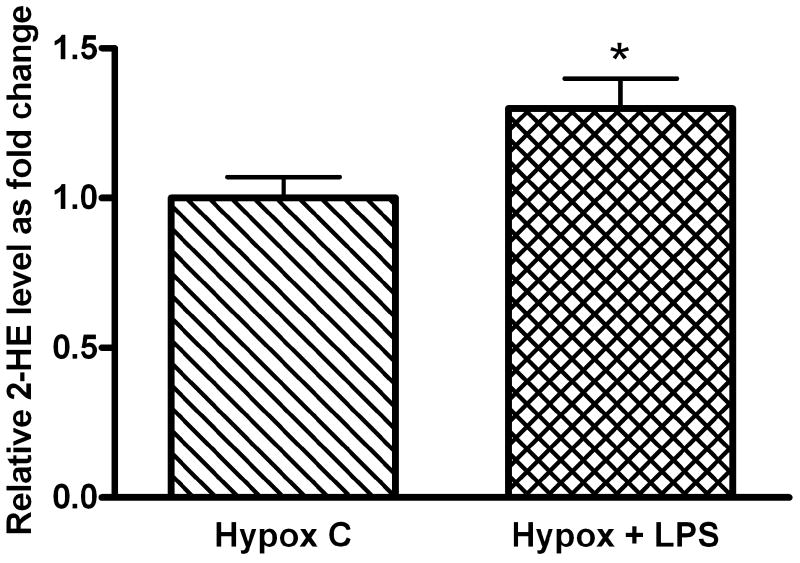
A) Quantification of intracellular 2-HE levels in LPS treated and untreated FPAEC in hypoxia: 2-HE peaks were quantified in FPAEC by HPLC after n-Butanol extraction. There was a 30% increase in 2-HE levels after LPS treatment in hypoxia-incubated FPAEC at 3 hours. Hypox C; Hypoxia control, Hypox + LPS; LPS treated FPAEC incubated in hypoxia. * - P=0.04.
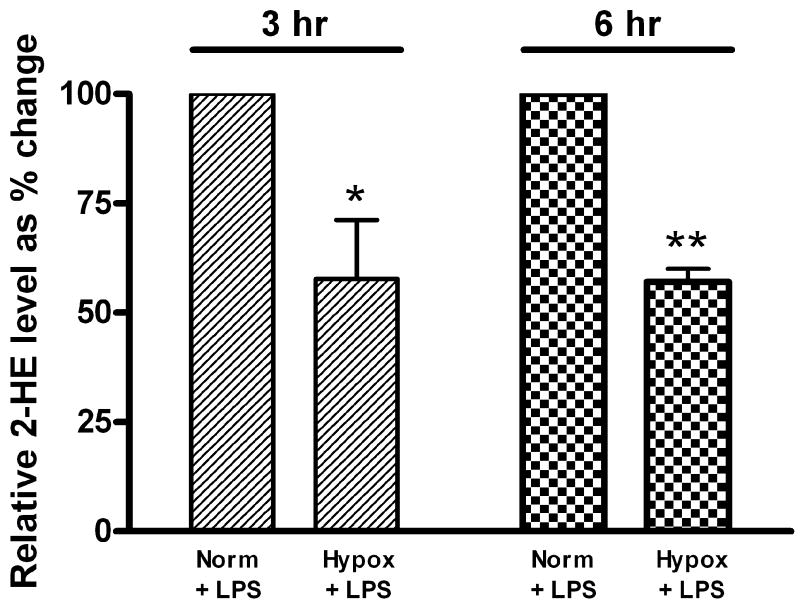
B) 2-HE levels in LPS treated FPAEC are lower in hypoxia: 2-HE levels were 40% lower in hypoxia vs. normoxia at 3- and 6-hours post LPS treatment. 2-HE levels in LPS treated FPAEC incubated in hypoxia are expressed relative to 2-HE levels in normoxia. Norm + LPS; LPS treated FPAEC incubated in normoxia, Hypox + LPS; LPS treated FPAEC incubated in hypoxia. * - P=0.003 & ** - P<0.001 (n=4 each).


