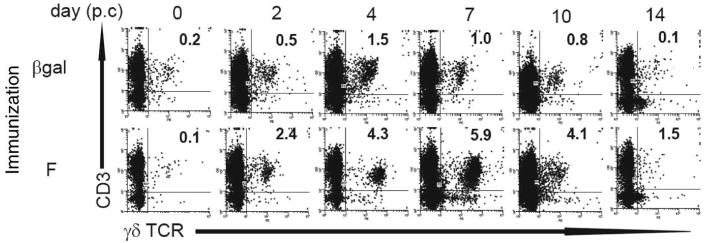
FIGURE 2.
Representative FACS analysis of TCRδ+CD3+ cells from the BAL of mice. Mice were scarified with rVV-β-gal (control), or rVV-F on day 0 and challenged intranasally with RSV on day 14. TCRδ+CD3+ cells in the BAL were identified by flow cytometry. Representative dot plots are shown for mice immunized with rVV-βgal or rVV-F over the time course of RSV infection. The percentage of TCRδ+CD3+ cells in the lymphoid gate (identified by size and granularity) is shown for each plot. Experiments were performed at least three times containing five mice per group.

