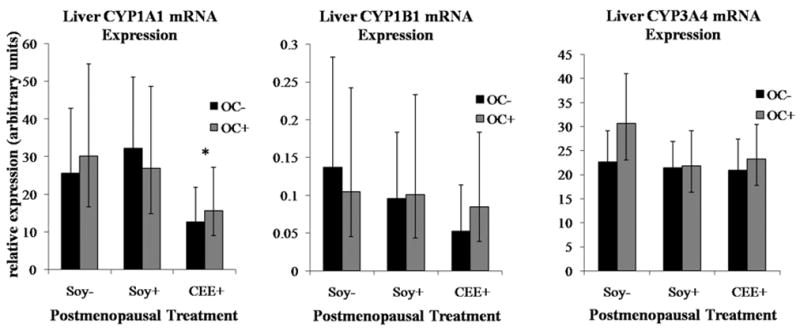
Figure 2. OC and IF treatment effects on liver CYP mRNA expression.

Values represent geometric means with 95% confidence intervals (95% CI). Significant differences are indicated as: *CEE effect relative to Soy− groups (p < 0.05)

Values represent geometric means with 95% confidence intervals (95% CI). Significant differences are indicated as: *CEE effect relative to Soy− groups (p < 0.05)