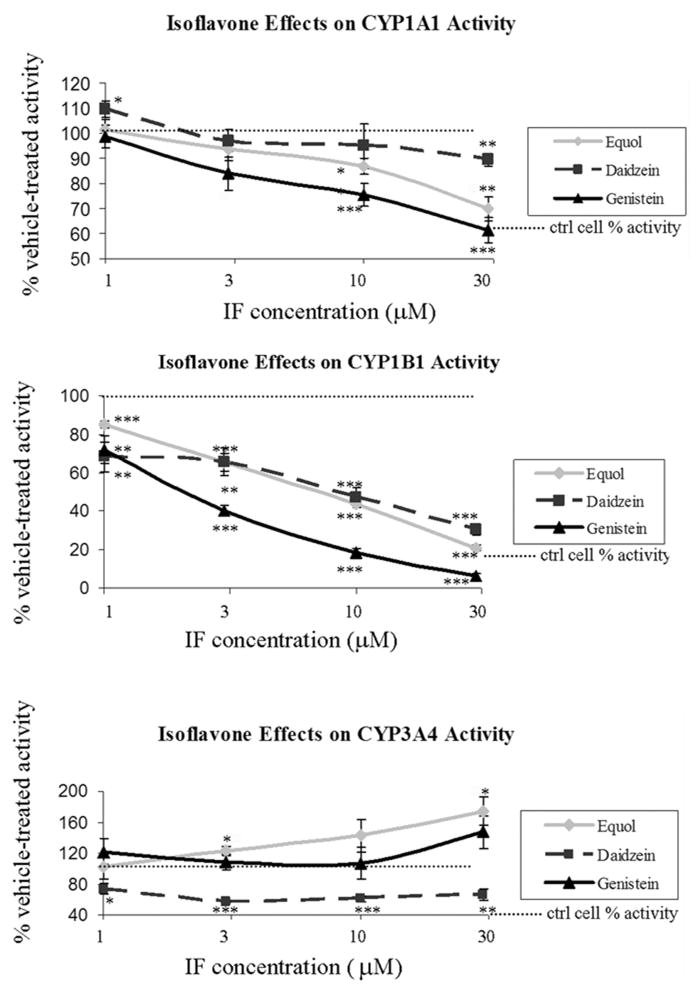
Figure 3. Isoflavone effects on activity of specific human CYP isozymes expressed in V79-MZ cells.
Plots represent data as a percentage of the activity within the vehicle treated cells (set at 100%) as represented by the dashed black line. Whiskers representing standard errors of the means are plotted for all treatments, but some are smaller than the associated markers and therefore not visible. Significant differences are indicated as: * isoflavone effect relative to vehicle treated cells at p < 0.05, ** isoflavone effect relative to vehicle treated cells at p ≤ 0.002, *** isoflavone effect relative to vehicle treated cells at p < 0.0001

