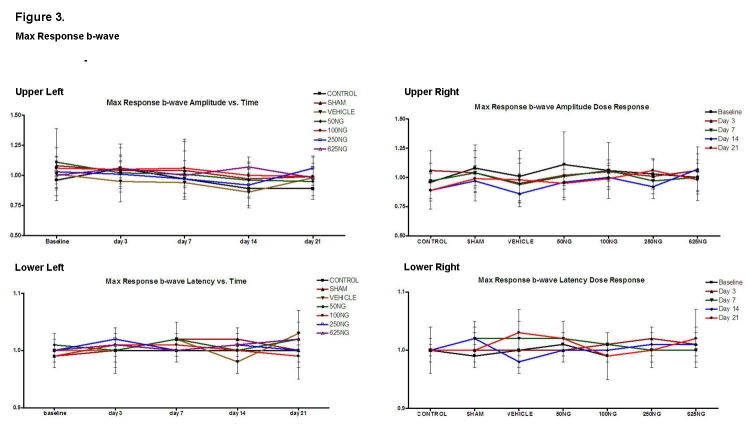
FIGURE 3.
Mean ± SD of scotopic maximum response b-wave amplitude and latencies as a function of time (upper left and lower left) and as a function of EPO dosage (upper right and lower right). Compared to the baseline, none of the values was significantly different in the upper left and lower left figures (P > .05). Also, compared to the control group, none of the values were significantly different in the upper right and lower right graphs (P > .05).

