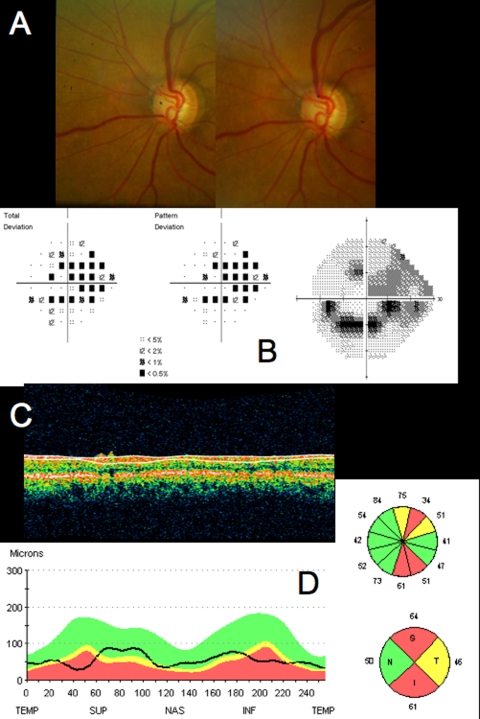
FIGURE 10.
Standard clinical images from a patient with advanced glaucoma and global retinal nerve fiber layer (RNFL) and visual loss: A, Stereoscopic disc photograph showing overall neuroretinal rim loss in the optic disc, evidenced by marked optic nerve cupping. B, Humphrey SITA 24–2 visual field threshold, total deviation, and pattern deviation maps, with central inferior scotoma and temporal superior loss. C, Time domain optical coherence tomography RNFL scan, with RNFL thickness segmentation. Note slight segmentation error due to algorithm oversmoothing of the anterior RNFL tissue border superiorly. D, Comparison of RNFL thickness to normative database. RNFL loss results in nearly all areas showing thicknesses that are borderline or outside normal limits, except the nasal portion, where tissue loss typically appears last. The RNFL is markedly thin superiorly and inferiorly.

