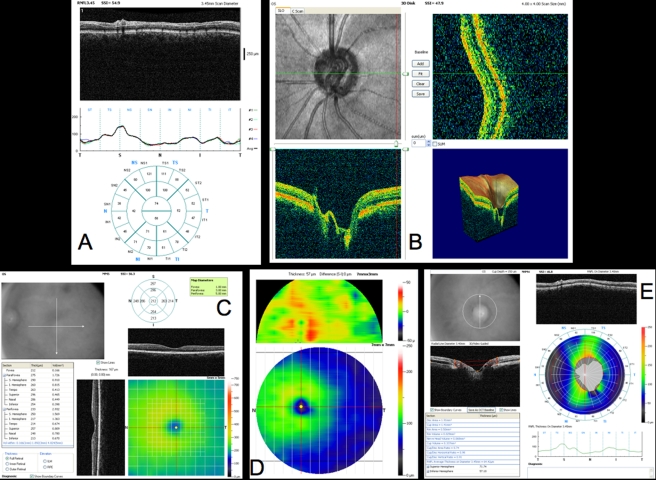
FIGURE 11.
Spectral domain optical coherence tomography (SD-OCT) scans from the patient shown in Figure 10 with advanced glaucoma and global retinal nerve fiber layer (RNFL) and visual loss. A, RTVue RNFL scan output. Note the improved segmentation superiorly, compared to time-domain OCT (TD-OCT) in Figure 10C. B, RTVue optical nerve head (ONH) 3D data set, showing larger area of optic nerve cupping and thin neuroretinal rim. C, RTVue MM5 macular scan output, showing temporal thinning with advanced glaucoma. D, RTVue MM7 macular scan output, also showing temporal loss, and overall thinning. This figure shows inner retinal thickness specifically, using a relatively new segmentation algorithm that allows segmentation of the intraretinal layers beyond simply total retinal thickness and macular RNFL thickness. This algorithm also permits superior to inferior macular comparison by subtraction, as shown in the upper panel of Figure 11D. This demonstrates asymmetry in inner retinal thickness, with the inner retina thinner inferiorly than superiorly, consistent with the RNFL thickness shown in Figures 10 C and D and 11A and the visual field shown in Figure 10B. Note on the visual field (Figure 10B) that while there is perimetric damage both above and below the horizontal meridian, with a superior nasal defect and an inferior paracentral scotoma, the inferior defect is considerably deeper than the superior one, as borne out by the TD-OCT and SD-OCT. E, RTVue NHM4 scan output shows extensive RNFL thinning, with minimal areas represented with warm colors, and substantial black and dark blue areas.

