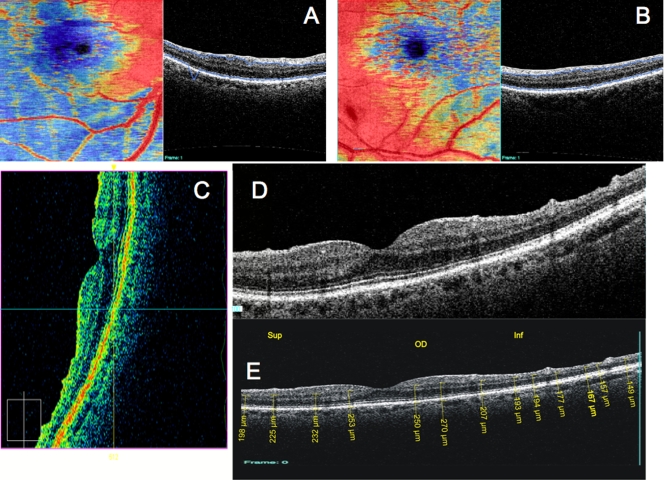
FIGURE 15.
Spectral comain optical coherence tomography (SD-OCT) images from the patient in Figure 14 with possible glaucoma: differential diagnosis case: A and B, Total retinal thickness segmentation software of our own design on macular 3D data sets from the right eye and left eye, respectively. Macula is in the top half of each image. Retinal thickness loss is evident inferior to the macula in the right eye compared to the left eye (blue is thinner than red), but it is unknown in which layer this loss occurred without examining the SD-OCT B-scans. C, Vertical scan from a SD-OCT 3D data set taken with the macula in the superior half of the scan. Note the tissue loss is in the inner retina, including the retinal nerve fiber layer (RNFL), retinal ganglion cell layer, and inner plexiform layer, with outer retinal layers measuring and appearing no different between the patient’s affected and unaffected eyes. D, Vertical OCT scan obtained by the Cirrus SD-OCT (left is the superior part of the scan, right is the inferior part of the scan). Retinal nerve fiber layer loss can be seen even more clearly in this scan, because of the device’s higher axial resolution and transverse scan density compared to time domain OCT, where the disease has left the retina with an irregular-appearing surface. E, Same scan as D, with aspect ratio of 1:1 to allow manual calipers retinal layer thickness measurements to assess which cellular layers of the retina are damaged.

