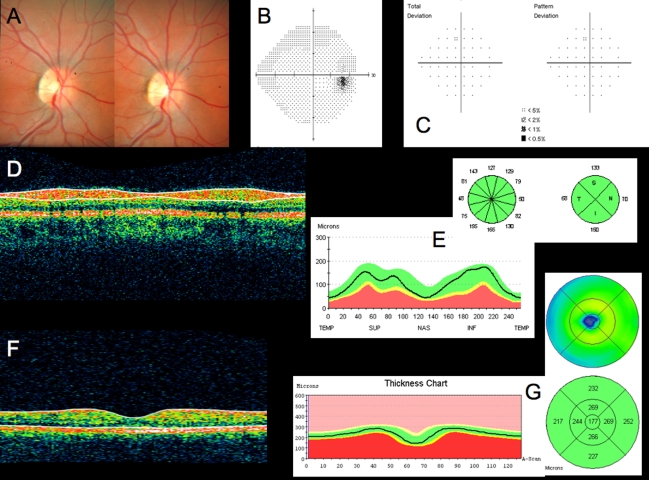
FIGURE 5.
Conventional testing images from healthy case study: A, Stereoscopic disc photographs of a 23-year-old white woman’s healthy right eye. B, Humphrey SITA 24–2 threshold map of healthy right eye. C, Total deviation and pattern deviation maps showing no significant deviation from normative values. D, Time domain ocular coherence tomography (TD-OCT) retinal nerve fiber layer (RNFL) thickness OCT scan, with white lines delineating RNFL boundaries. The white lines are automatically placed by software that automatically identifies the tissue borders of interest, but should always be checked by the clinician for accuracy. E, RNFL segmentation results superimposed on normative database. Green is within normal limits (5th to 95th percentile), yellow is borderline (1st to 4th percentile) and red is outside normal limits (below the 1st percentile). Wheels present quadrant and clock hour averaged thicknesses. All green results indicate RNFL thickness is within normal limits. F, TD-OCT macular thickness OCT scan, with white lines designating total retinal thickness segmentation results. G, Single macular scan and macular map results. Single scan and overall measured thicknesses are compared to normative values. Map represents thicker measurements with warmer colors, and thinner measurements with cooler colors (eg, the fovea is dark blue, as the thinnest region in the healthy eye).

