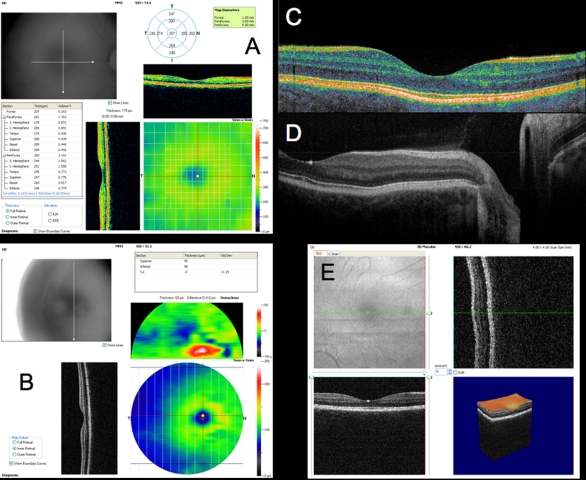
FIGURE 6.
Macular spectral domain optical coherence tomography (SD-OCT) images from healthy case study shown in Figure 5. A, RTVue MM5 output, with fundus camera view, vertical and horizontal OCT scans through macula, macular map, and tabular thickness measurements. B, RTVue MM7 output, with macular map, map of superior-inferior thickness differences, and vertical OCT B-scan through the macula. The red area indicating a large difference between the superior and inferior hemispheres at that point is an artifact of slight decentration of the macula vertically in that scan. C, High-resolution color mapped SD-OCT line scan through macula acquired by research device created at Massachusetts Institute of Technology, displaying retinal layers clearly. D, High-resolution grayscale SD-OCT line scan through macula and optic nerve head acquired by Bioptigen SD-OCT device. E, Macular 3D data set acquired by RTVue SD-OCT. Upper left is the OCT fundus image. Lower left and upper right B-scans are at the locations of the green and red lines on the OCT fundus image, respectively. 3D representation is at lower right.

