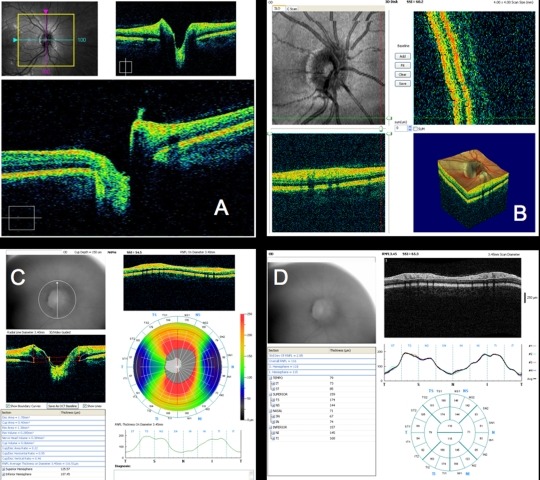
FIGURE 7.
Optic nerve head (ONH) and retinal nerve fiber layer (RNFL) spectral domain optical coherence tomography (SD-OCT) images from healthy case study shown in Figures 5 and 6: A, Cirrus HD-OCT ONH 3D data set. Lower B-scan and upper B-scans are from position of blue and purple lines on the fundus view, respectively. B, RTVue ONH 3D data set. Upper left is en face image. Note vessel disconnect near top, indicating eye motion. Lower left and upper right B-scans are at the locations of the green and red lines on the en face image, respectively. 3D representation is at lower right. C, RTVue NHM4 scan pattern output. NHM4 is a pattern of radial scans combined with circular scans. Fundus view is in upper left. Radial B-scan and circular B-scan are indicated by red; white lines imposed over the RNFL thickness map represent other acquired scans. Warm colors in the map represent thick, healthy nerve fiber bundles. The 3.4-mm-diameter circle thickness graph and other parameter measurements are presented. D, RTVue RNFL scan pattern output. RNFL scan consists of four 3.4-mm-diameter circles around the ONH, whose RNFL segmentation thickness measurements are averaged. Sectorally averaged thicknesses are displayed in the round chart.

