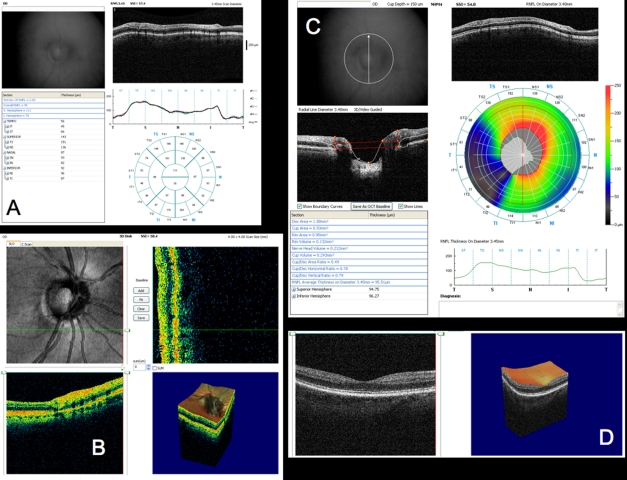
FIGURE 9.
Spectral domain optical coherence tomography (SD-OCT) scans from the patient shown in Figure 8 with early glaucoma and a focal retinal nerve fiber layer (RNFL) defect. A, RTVue RNFL scan output. Note the clear inferior temporal notch, which can be more clearly measured without the oversmoothing problem of time domain OCT. B, RTVue 3D optical nerve head (ONH) 3D data set. Note how the tissue loss can be clearly seen in the B-scan obtained at the green line on the en face image, visible in the lower left corner. C, RTVue NHM4 scan output. Black and dark blue area inferior temporally indicates area of focal loss. The rest of the scan appears fairly healthy and thick. D, RTVue 3D data set from a macular scan, with 3D representation.

