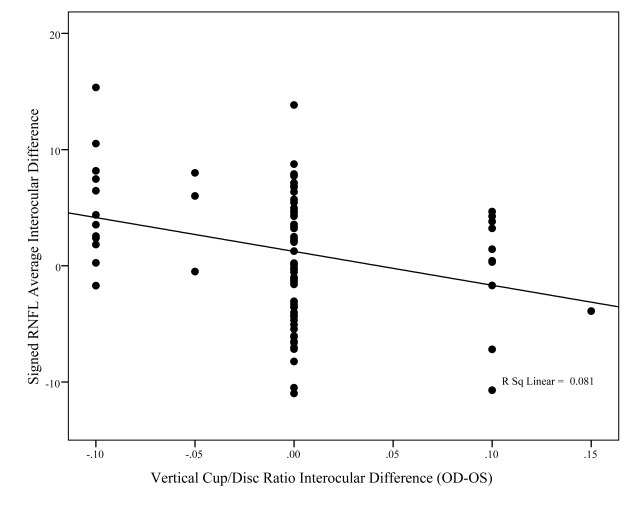
FIGURE 10.
This graph shows the relationship between interocular difference in fast mean retinal nerve fiber layer (RNFL) thickness (y-axis) and interocular difference in vertical C:D ratio (x-axis). Although the relationship is statistically significant (P = .005), this relationship accounted for only 8% of the variability in interocular differences between individuals (R2 = 0.081).

