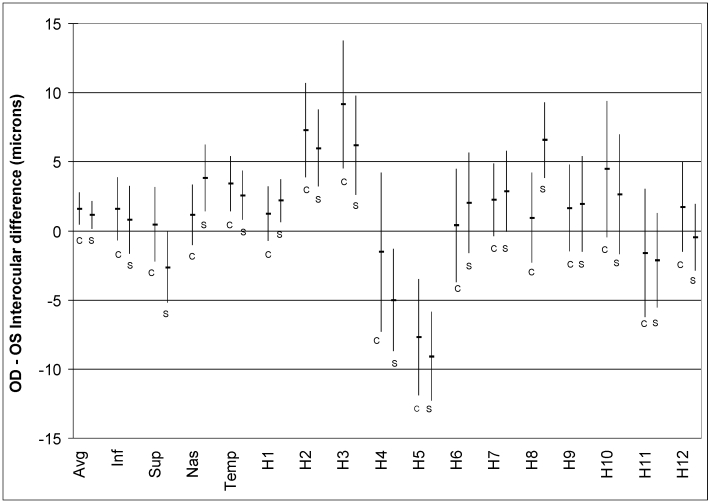
FIGURE 12.
Results of the analysis performed in 47 unique normal subjects using Cirrus OCT compared to the fast scan results of the Stratus OCT from the larger cohort that is the primary subject of this thesis. The graph shows similar interocular differences for mean RNFL, quadrants, and clock-hours, both in direction and magnitude. Since scan circle placement by the operator is not necessary in Cirrus OCT, it would appear that interocular differences are not a function of scan circle placement.

