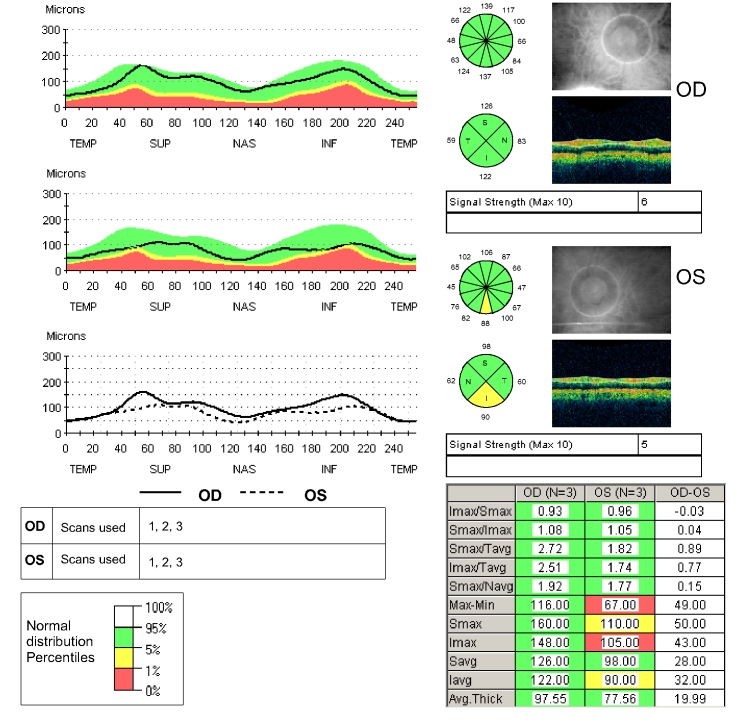
FIGURE 4.
Peripapillary fast Stratus OCT scan of the right and left eyes of the patient described in Figures 2 and 3. The Stratus OCT peripapillary retinal nerve fiber layer (RNFL) printout provides a number of representations of RNFL thickness measurements. The TSNIT plot (upper left) is a representation of the patient’s RNFL thickness (black line) in the 3.4-mm-diameter circle around the optic disc, starting in the temporal region (9:00 in the right eye and 3:00 in the left eye), then moving toward the superior region (12:00 in both eyes), then nasally (3:00 right eye, 9:00 left eye), then inferiorly (6:00 both eyes), and then winding up directly temporally. When the black line is in the green area of the graph, the RNFL thickness is normal in that location compared to normal age-matched controls. When the line dips into the yellow area, the patient’s RNFL thickness is considered thinner than the thinnest 5% of normal age-matched controls. When the black line dips into the red area, the patient’s RNFL thickness is considered thinner than the thinnest 1% of normal age-matched controls. Moving clockwise on the printout, the circle representation of the RNFL thickness is divided into clock-hour pictures, with RNFL averages for each of 12 clock-hours displayed in green, yellow, or red and interpreted in the same manner as compared to normal age-matched controls. Below the clock-hour circle is the quadrant circle, which is the average measurements in each of the 4 quadrants, color-coded and interpreted in the same manner. To the right of the circle representations is a black and white photograph of the optic disc and peripapillary region taken immediately after scanning is completed to document where around the optic disc the scan is actually being taken. The table of numbers in the lower right portion of the printout provides a variety of comparisons between upper and lower hemifields and between eyes, but the most interesting for our purposes are the mean RNFL values for right and left eyes given at the bottom of the table. And in the lower left are the TSNIT plots for both right and left eyes superimposed on each other. Note in this patient that the left mean retinal nerve fiber layer thickness is 20 μm thinner than the right and that the superimposed right/left TSNIT plots show mild thinning in the superior and inferior areas of the left eye. The 6:00 clock-hour in the left eye is shaded yellow, indicating that the patient’s average RNFL thickness measurement is thinner than 5% of that of age-matched controls. Also, the inferior quadrant of the left eye is shaded yellow. This corresponds well with the asymmetric intraocular pressures, mild C:D asymmetry, and 1-dB difference in mean deviation on the visual field between eyes. The OCT is the only test with a frankly abnormal result, the mild thinning inferiorly in the left eye.

