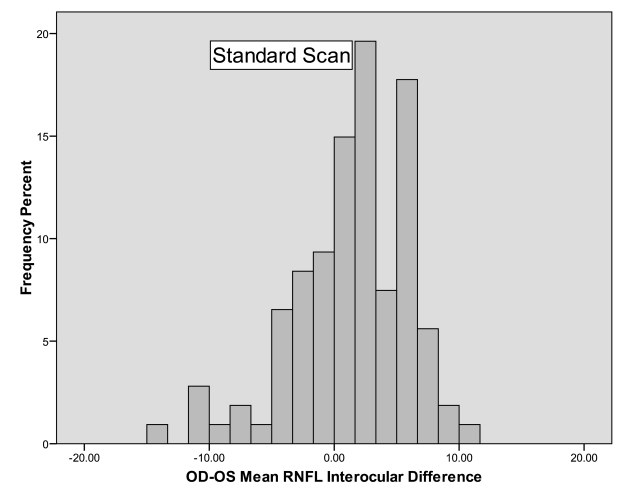
FIGURE 6.
Histogram showing the frequency distribution of the differences in retinal nerve fiber layer (RNFL) thickness between right and left eyes measured by the standard scan algorithm of the Stratus OCT. The histogram is slightly skewed to the left, with more subjects having a slight positive difference in the right minus left interocular differences than those having a negative difference.

