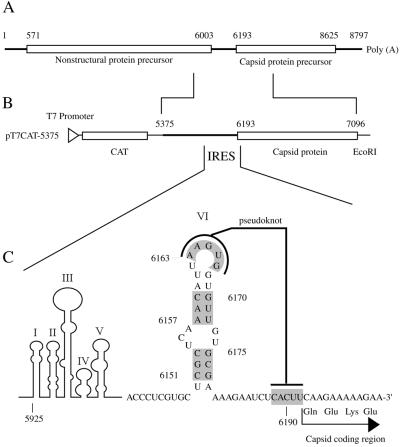
Figure 1.
Schematic diagram of the PSIV genome, pT7CAT-5375, and the IRES region of pT7CAT-5375. (A) Organization of the PSIV genome. The open boxes and bold lines indicate coding and noncoding regions, respectively. The numbers on the line represent nucleotide positions in the PSIV sequence. (B) Organization of the dicistronic plasmid, pT7CAT-5375, which contains the chloramphenicol acetyltransferase (CAT) gene and the 5′ portion of the capsid protein gene of PSIV. The thin line indicates the vector sequence, and the triangle on the line represents the location of the T7 promoter sequence. The thick line is the PSIV sequence. The numbers on the lines represent nucleotide positions in the PSIV sequence. (C) The predicted stem–loop structures (I–VI) upstream of the capsid-coding region of PSIV. Mutations were introduced into the shaded regions in stem–loop VI and in nucleotides 6190–6192. The base pair interactions in the predicted pseudoknot between the loop of the stem–loop structure (nucleotides 6163–6167) and the sequence just upstream of the capsid-coding region (nucleotides 6188–6192) are connected with a bold line.

