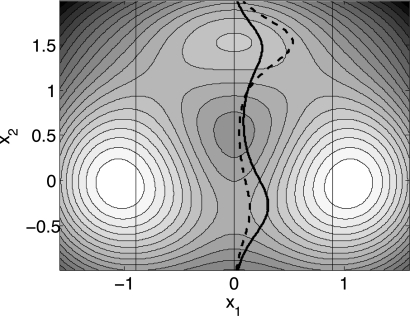
Figure 6.
Contour plot of the three-hole potential. We use three milestones, shown as vertical lines and corresponding to (from left to right) q(x)=0, q(x)=0.5, and q(x)=1. The density 10 (thick solid line) on the surface q(x)=0.5 shows that the lower channel is the preferred one, even though the equilibrium density (thick dashed line) is peaked in the upper channel.

