
Figure 1.
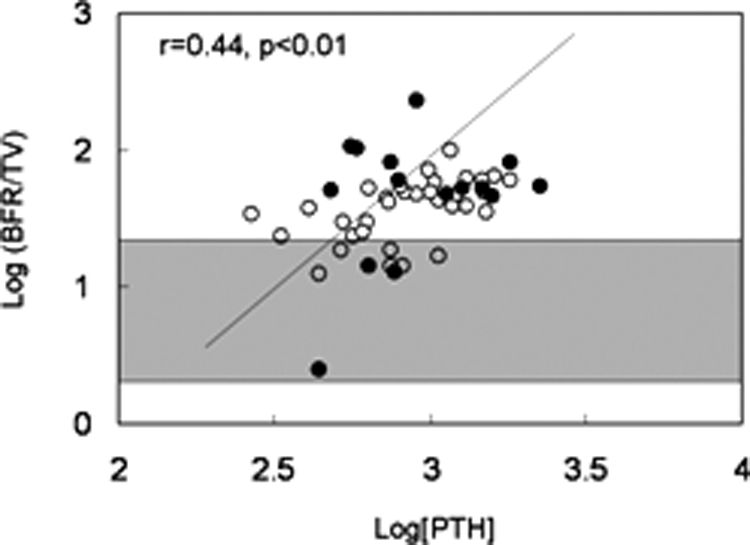
Relationship between log[PTH] and log[bone formation rate/tissue volume]. Open circles depict patients with residual renal function; closed circles depict anuric patients. The shaded area represents the normal range for bone formation rate/tissue volume in children with normal kidney function.