
Figure 3.
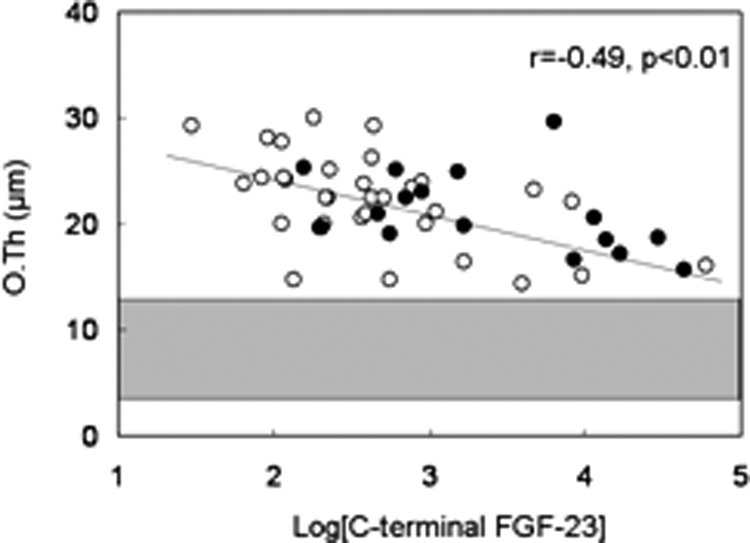
Relationship between log[C-terminal FGF-23] and osteoid thickness (O.Th). Open circles depict patients with residual renal function; closed circles depict anuric patients. The shaded area represents the normal range for osteoid thickness in children with normal kidney function.