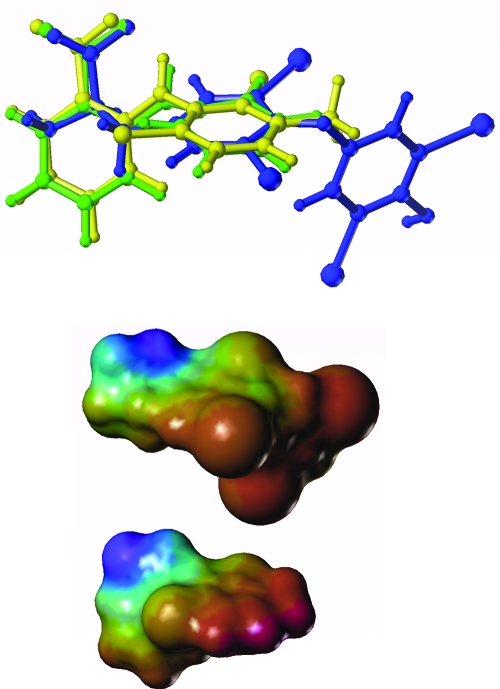
Figure 7.
Structural and electrostatic comparison of T4 and fenamate inhibitors of Oatp1c1. Upper panel, Overlay of T4 (blue), fenamic acid (green), and meclofenamic acid (yellow) using Multifit in Sybyl 7.2. There were 12 atoms in each molecule used in the alignment. Simulated annealing was used to sample viable structural conformations. Lower panel, Electrostatic surface potential of T4 (top) and meclofenamic acid (bottom). The electrostatic potential was mapped onto the Connolly surface using MOLecular Computer Aided Design.

