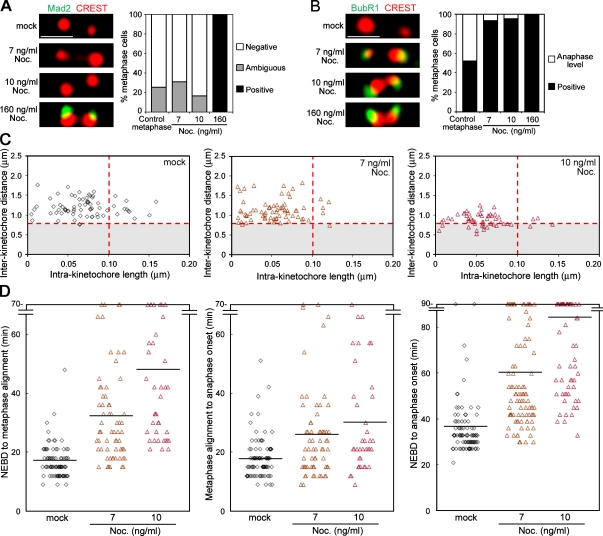
Figure 2.
Kinetochore stretching is required to inactivate the SAC. (A) Release of Mad2 from kinetochores in low nocodazole (Noc.) conditions. The kinetochore Mad2 staining in cells treated with the indicated concentrations of nocodazole (left) were classified according to their intensities. A histogram compares the percentages of metaphase cells that have no Mad2 on any kinetochores (white) with cells that have positive (black) or ambiguous (gray) Mad2 staining on at least one kinetochore (n = 16 cells). (B) Enrichment of BubR1 at kinetochores in the low nocodazole conditions. Kinetochore BubR1 intensities were classified into high (positive; black) or low (anaphase level; white). The percentages of metaphase cells for BubR1 staining were summarized in a histogram as in A (n = 16 cells). (C) Suppression of the kinetochore stretching in low nocodazole conditions. Kinetochore profiles were analyzed in the conditions indicated. Red dotted lines represent threshold values defined in Fig. 1 B. The stretched kinetochores were found in 15.5%, 6.9%, and 7.1% of cases, and the interkinetochore distances were 1.19 ± 0.03 µm (mean ± SEM), 1.13 ± 0.03 µm, and 0.88 ± 0.02 µm for mock (n = 71, 9 cells) and 7-ng/ml (n = 72, 7 cells) and 10-ng/ml (n = 56, 6 cells) nocodazole conditions, respectively. (D) Mitotic progression in low nocodazole conditions. The time intervals between the indicated mitotic events were measured in mock (n = 86 cells) or 7-ng/ml (n = 65 cells) or 10-ng/ml (n = 38 cells) nocodazole treatment experiments. Horizontal lines indicate the mean. Bars, 1 µm.

