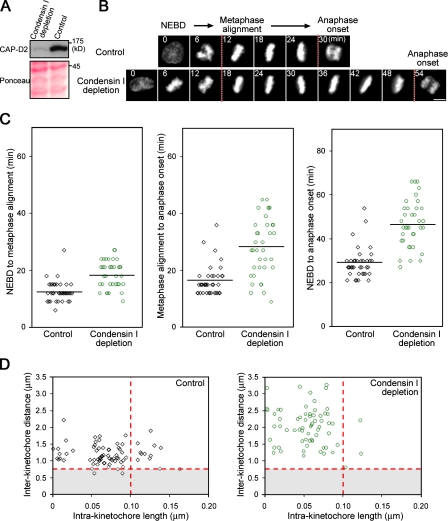
Figure 3.
Suppression of kinetochore stretching by condensin I depletion correlates with a delay in mitotic progression. (A) Depletion of CAP-D2. Cells transfected with the indicated siRNA were analyzed by Western blotting with CAP-D2 antibodies. The Ponceau S staining serves as a loading control. (B) Live cell imaging of condensin I–depleted cells. EGFP–histone H2B–expressing cells were transfected with siRNAs and analyzed after 72 h. Mitosis images were extracted from long-term imaging experiments and aligned on the time axis according to nuclear envelope breakdown (NEBD). The time points for metaphase alignment and anaphase onset are defined by dashed lines. (C) Mitotic progression in condensin I–depleted cells. The time intervals between the indicated mitotic events were measured in control (n = 38 cells) or condensin I RNAi (n = 36 cells) experiments. Horizontal lines indicate the mean. (D) Kinetochore stretching is suppressed in condensin I–depleted cells. Kinetochore profiles were assessed with the threshold values defined in Fig. 1 B (red dotted lines). The incidences for the kinetochore stretching were 16.2% and 4.5%, and the interkinetochore distances were 1.19 ± 0.03 µm (mean ± SEM) and 2.02 ± 0.07 µm for control (n = 74, 9 cells) and condensin I–depleted cells (n = 66, 10 cells), respectively. Bar, 10 µm.

