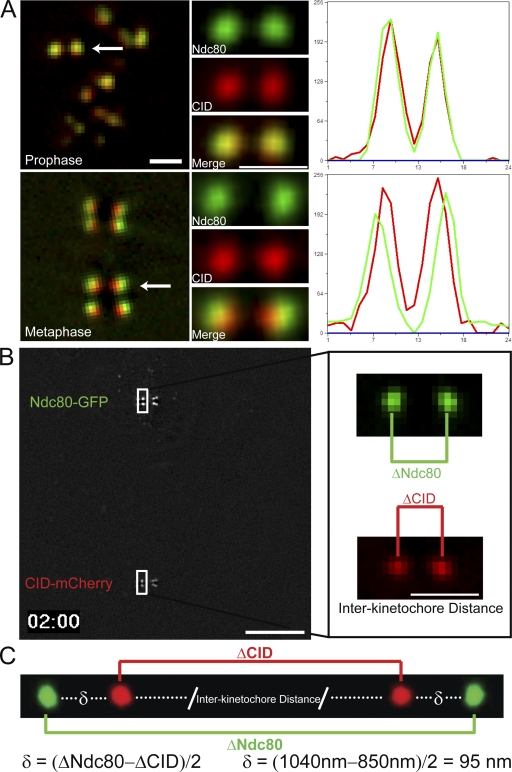
Figure 1.
K-Tensor Drosophila S2 cells exhibit detectable changes in the distance between the inner and outer layers of the kinetochore. (A) Representative micrographs of prophase and metaphase K-Tensor cells expressing Ndc80-GFP (green) and CID-mCherry (red). Ndc80, CID, and merged images are shown for the highlighted kinetochore pairs (white arrows). Line scans for each of the kinetochore pairs are shown to the right of each pair, with the red line indicating CID-mCherry intensity and the green line reflecting Ndc80-GFP intensity. (B) A single frame from a dual-view imaged K-Tensor cell (Video 1, available at http://www.jcb.org/cgi/content/full/jcb.200808130/DC1) showing simultaneous imaging of Ndc80-GFP and CID-mCherry. The inset shows enlarged images of the Ndc80 (green) and CID (red) signals for the highlighted kinetochore pair (white boxes). The distances between the two brightest pixels for each pair are represented by ΔNdc80 and ΔCID. (C) To calculate delta (δ), which is the distance between Ndc80-GFP and CID-mCherry, ΔCID is subtracted from ΔNdc80 and divided by two. Bars: (A and B, inset) 1 µm; (B) 10 µm.

