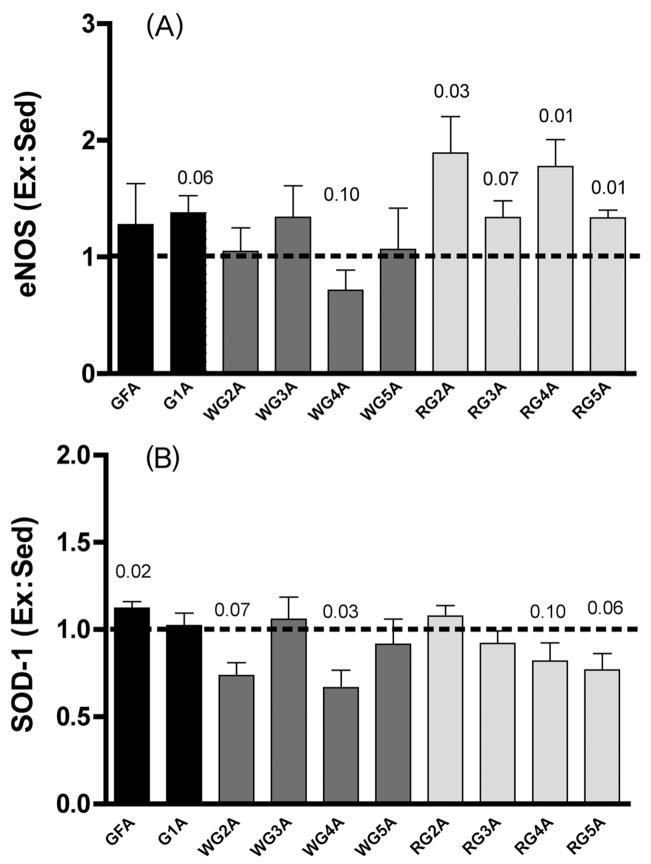
Fig. 3.
(A) eNOS protein expression in gastrocnemius (G) resistance vessels. GFA, G feed artery. Values are means ± SE; heights of bars represent the ratios of expression in tissues from exercise-trained (Ex) rats to that in tissues from sedentary (Sed) rats. Ex is significantly greater than Sed (p < 0.05) for RG 2A, 4A, and 5A arterioles; borderline significance (0.05 < p < 0.10) is also indicated. WG, white gastrocnemius; RG, red gastrocnemius. (B) SOD-1 protein expression in G resistance vessels. Note that Ex is significantly greater than Sed in only GFA. (From McAllister et al. 2005, reproduced with permission from J. Appl. Physiol., Vol. 98, p. 760. #2005 The American Physiological Society.)

