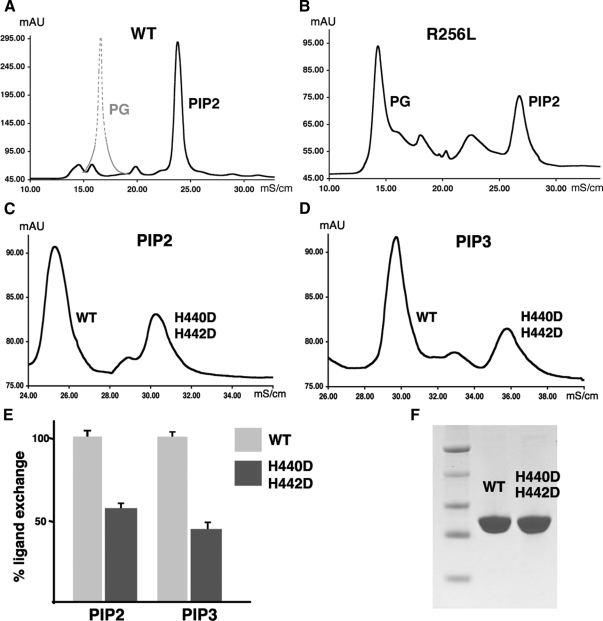
Figure 7.
Loop mutant SF-1 proteins exhibit impaired ligand exchange compared with wild-type protein. A, Chromatographic ion exchange profile for wild-type (WT) SF-1 LBD after ligand exchange. The peak corresponding to the ligand-exchanged PIP2-bound wild-type SF-1 is shown in black, whereas the position of the peak for the original PG-bound wild-type SF-1 is indicated by dashed gray line. Quantification of the peak volumes at a 5:1 ligand-protein molar ratio suggests an exchange rate of approximately 90%. B, Analogous chromatographic profile for R256L SF-1 mutant. Peaks corresponding to the original PG-bound and PIP2-bound SF-1 are indicated. The ligand exchange rate for loop L2-3 SF-1 mutant is less than 30%. C and D, Chromatograms for ligand-exchanged wild-type and H440D/H442D mutant SF-1 proteins with either PIP2 (panel C), or PIP3 (panel D) bound. Differences between electrostatic properties of wild-type SF-1 and H440D/H442D variant allowed for a simultaneous comparative ligand exchange analysis. E, Results of three independent ligand exchange experiments are presented as bar graph. Ligand exchange rates for PIP2- and PIP3-bound H440D/H442D mutant protein (dark gray) are compared with the analogous rates for wild-type SF-1 (light gray). F, Wild-type and H440D/H442D mutant proteins exhibit equal stability and solubility as judged by SDS-PAGE analysis.

