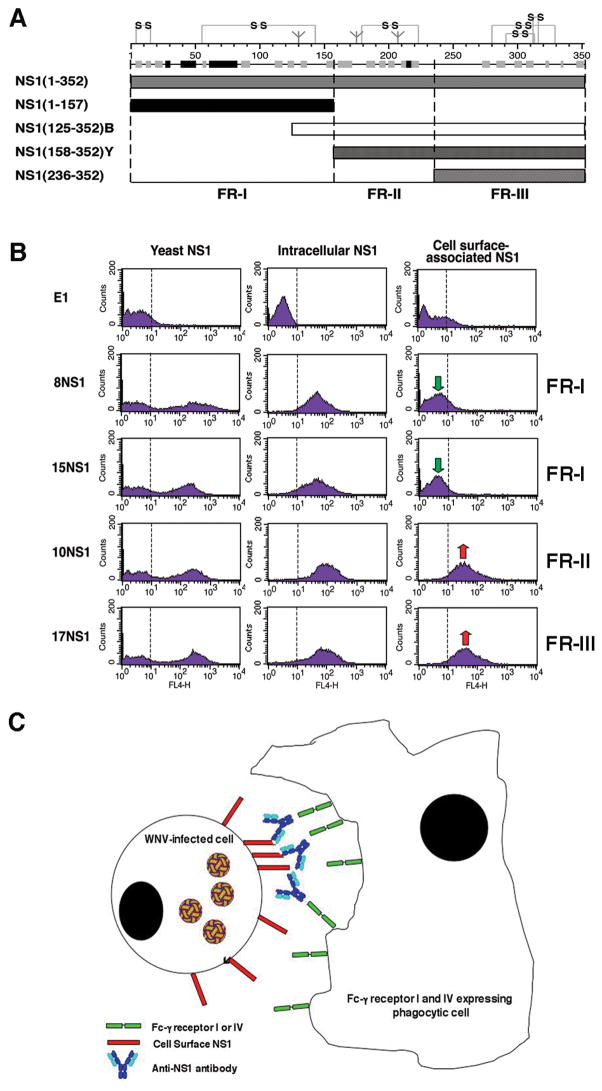
Fig. 6. Mechanism of protection against WNV by anti-NS1 antibodies.
(A). Schematic diagram of NS1 fragments. (Top) A secondary structure prediction model, putative disulfide bonding patterns, and N-linked glycosylated sites are depicted. The secondary structure model is a consensus prediction based on NS1 from several different flaviviruses. (Bottom) Diagram of expression constructs used for yeast surface display and bacterial expression of NS1 fragments. NS1(125–352)B and NS1(158–352)Y indicate E. coli and yeast expressed FR-II-III, respectively. Adapted from (27). (B). Flow cytometry histograms showing immunoreactivity of NS1 on the surface of yeast, within permeabilized Raji-WNV cells, and on the surface of Raji-WNV-cells with individual anti-NS1 mAbs. Representative histograms are shown for four NS1 mAbs (8NS1, 15NS1, 10NS1, and 17NS1). The E1 mAb against WNV E protein was used as a negative control. Green and red arrows indicate the absence or presence of binding of mAbs to cell surface-associated NS1, respectively. The fragment localization of NS1 antibodies is indicated to the right. (C). Model of antibody and NS1-dependent clearance of WNV-infected cells by Fc-γ receptor I and IV-expressing phagocytes. WNV-infected cells express cell-associated forms of NS1 on their surface, which can be bound by subsets (fragment II and III-specific) antibodies. NS1-specific antibodies of a given IgG subclass (e.g. mouse IgG2a) are recognized by activating Fc-γ receptors (mouse Fc-γR I or IV) resulting in phagocytosis and clearance of infected cells.

