Figure 1.
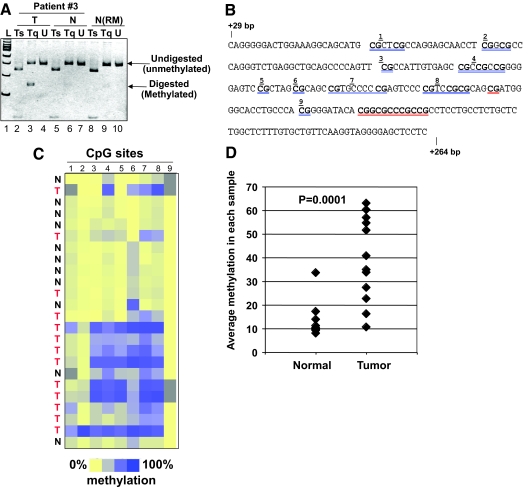
PTPRO CpG island is methylated in primary breast tumors. A, Genomic DNA isolated from primary breast tumor samples and matching adjacent normal tissue (n = 21) was subjected to COBRA. PCR-amplified PTPRO promoter fragment from a representative patient [no. 3; Tumor (T); and Normal (N)] and that from a normal individual (reduction mammoplasty, N-RM) were digested with Tsp509 I (Ts) or TaqI (Tq) or mock digested (U). The digested products were separated by polyacrylamide gel electrophoresis along side 100-bp ladder (L). B, MassARRAY, Sequence of PTPRO CpG island (+29 to +264) amplified for MassARRAY. Each individual or group of CpGs underlined in blue is represented by the corresponding number in the dendrogram in panel C. Data for the CpGs underlined in red could not be obtained due to low-/high-fragment mass. C, PTPRO CpG island amplified from BS-treated DNA of primary breast cancer samples (T) and normal adjacent tissue (N) were subjected to MassARRAY (EpiTYPER). Each square represents a single CpG or a group of two or three CpGs (see panel B) and each row represents a sample. Methylation frequency ranges from 0% (yellow) to 100% (dark blue). Gray indicates unavailable data. Samples include tumor (T) and normal (N) from breast cancer patients. D, Quantification of the EpiTYPER data as percent methylation of the PTPRO CpG island in tumor and normal tissues.

