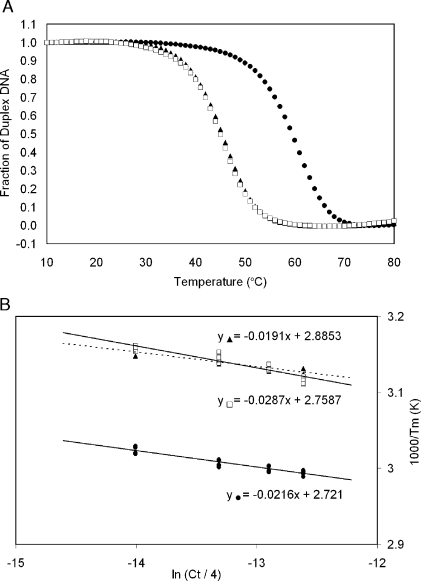
Figure 7.
(A) Hybridization plots (alpha curves) for the duplexes containing the unmodified T6•A19 base pair (•), the Tg6•A19 base pair (▲), and the Tg6•G19 base pair (◻). (B) van’t Hoff plots of Tm−1 vs ln(Ct/4) for the duplex containing the unmodified T6•A19 base pair (•), the Tg6•A19 base pair (▲), and the Tg6•G19 base pair (◻).

