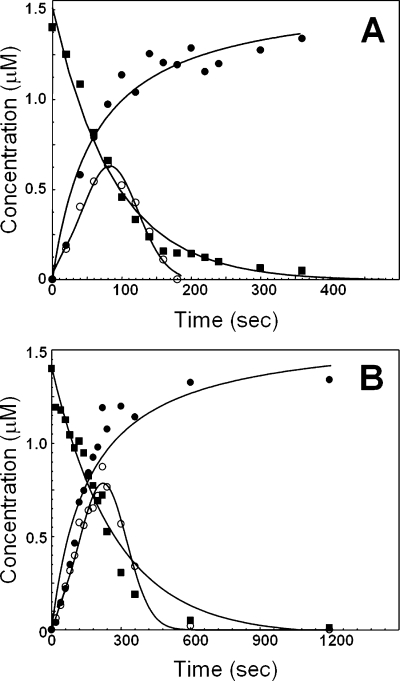
Figure 5.
Reaction profiles for the activation of prothrombin by prothrombinase. Progress curves for products and reactants for the activation of prothrombin by prothrombinase assembled with factor VaWt (A) or factor VaΔ680−709 (B) were obtained by quantitative scanning densitometry of gels shown in panels A and B of Figure 4, as described in . The graphs illustrate the disappearance of prothrombin (◼), the transient formation of meizothrombin (○), and the accumulation of the B chain of α-thrombin (●). There is a 3-fold difference in the x-axis between the two panels, because prothrombinase assembled with factor VaΔ680−709 consumes prothrombin with an ∼3-fold slower rate than prothrombinase assembled with factor VaWt. The lines for the disappearance of prothrombin were drawn according to the equation of a one-phase exponential decay (for factor VaWt, R2 = 0.985; and for factor VaΔ680−709, R2 = 0.968). The lines depicting the formation of meizothrombin and the accumulation of the B chain of α-thrombin were arbitrarily drawn. Additional data points extending to incubation for 1 h (shown in Figure 4) have been omitted for clarity.

