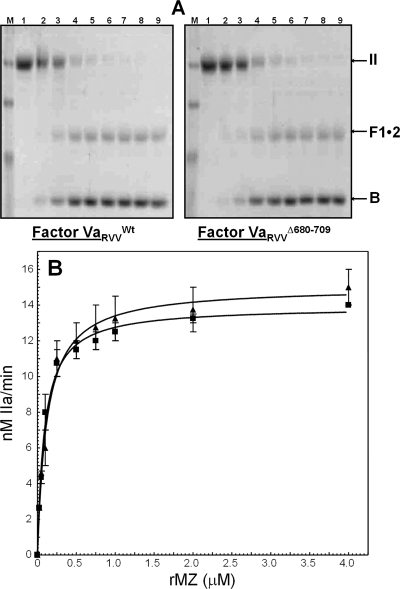
Figure 6.
Analysis of the activation of rMZ-II. (A) Gel electrophoretic analyses. rMZ-II (1.4 μM) was incubated in different mixtures with PCPS vesicles (20 μM), DAPA (3 μM), and factor VaWt (left panel, 20 nM) or factor VaΔ680−709 (right panel, 20 nM). The reaction was started by the addition of factor Xa, and the samples were treated as detailed in . Lanes 1−9 contained samples of the reaction mixture following incubation of prothrombinase with rMZ-II before (lane 1) or following incubation for 0.5, 1, 2.5, 4, 6, 10, 20, and 30 min with factor Xa, respectively. Positions of prothrombin-derived fragments are indicated at the right as detailed in the legend of Figure 4. The factor Va species used for the reconstitution of prothrombinase are shown under each panel. (B) Kinetic analyses. Initial rates of α-thrombin generation were determined as described in , and the data were plotted according to the Michaelis−Menten equation. Data for activation of rMZ-II by prothrombinase assembled with factor VaWt are shown with filled squares (R2 = 0.98), while data for activation of rMZ-II by prothrombinase assembled with factor VaΔ680−709 are depicted with filled triangles (R2 = 0.96). Kinetic constants reported in the text were extracted directly from the graphs.

