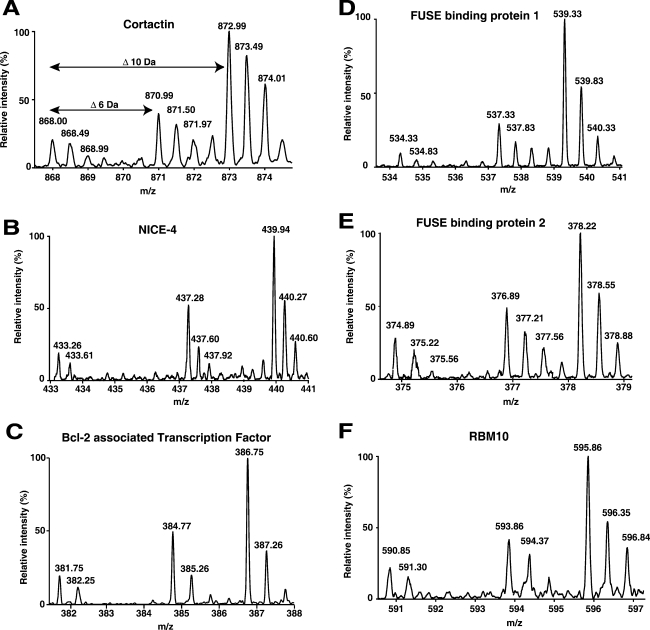
Figure 3.
MS spectra of 6 proteins identified as Src substrates by SILAC. The 3 spectral peaks in each figure represent the mass shift of the same peptide. The relative increase in intensity ratios between light to heavy are represented below in parentheses. (A) A doubly charged peptide from cortactin (1:7); (B) a triply charged peptide from NICE-4 (1:7); (C) a doubly charged peptide from Bcl2-associated transcription factor (1:7.5); (D) a doubly charged peptide from FUSE-binding protein 1 (1:8); (E) a doubly charged peptide from FUSE-binding protein 2 (1:4); (F) a doubly charged peptide from RNA binding motif 10 (1:7.5).

