Figure 6.
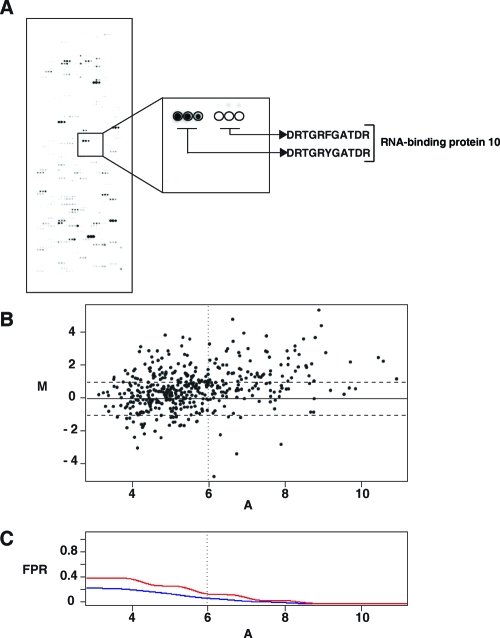
(A) Peptide microarrays: in vitro kinase assays performed on peptide microarrays, where all tyrosine containing peptides and their corresponding Y → F mutant counterparts were spotted on glass slides. A representative section of the peptide microarray is magnified to show the signal corresponding to a peptide and its Y → F mutant. (B) A classical MvA plot displaying data pertaining phosphorylation intensities on peptide microarrays. The horizontal dotted lines indicate 2-fold difference between WT and MUT intensity values. The vertical dotted line corresponds to a local false positive rate of 0.15. M on the Y-axis represents differential of (log 2 WT − log 2 MUT intensity values for each peptide and A on the X-axis represents average intensities ([log 2 WT + log 2 MUT]/2). (C) A plot displaying classical and local false positive rates (FPR). The red line represents local false positive rate curve and the blue line represents the classical false positive rate. The vertical dotted line shows where the local FPR = 0.15. All peptides to the right of the vertical dotted line and above 2-fold (horizontal line) were selected as true positives.

