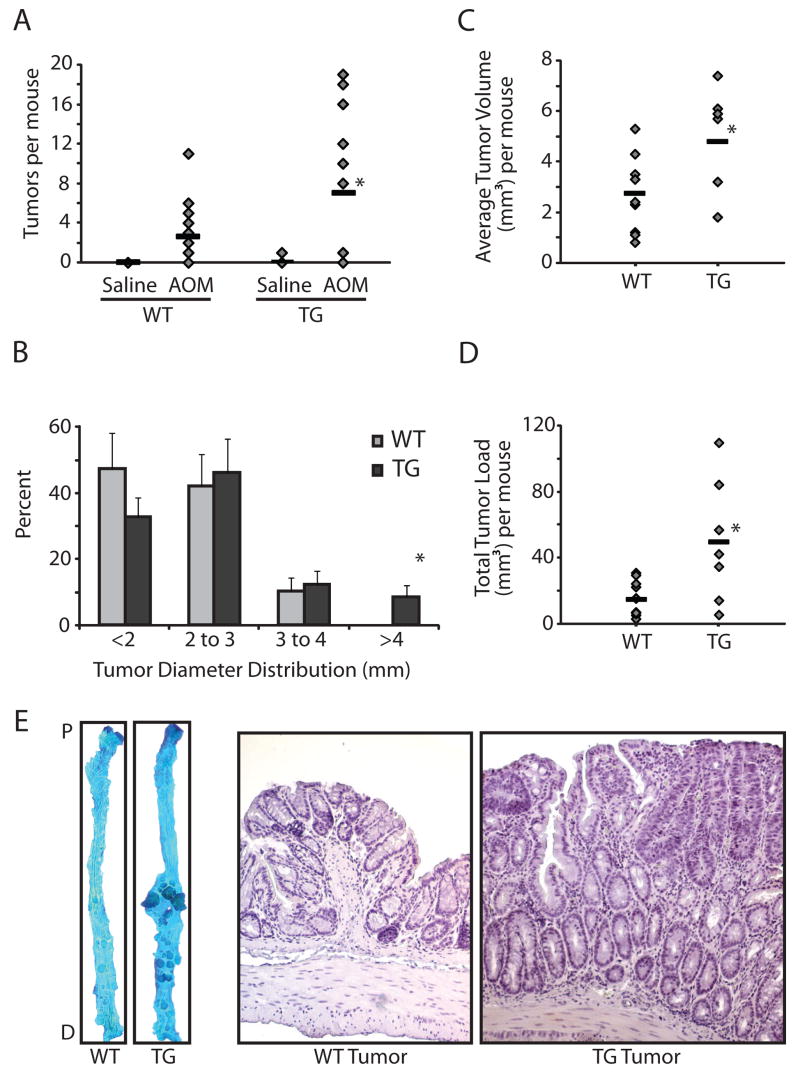
Figure 2.
Increased tumor multiplicity and size in COX-2 transgenic mice. A. Tumor count. Mice treated with AOM or saline were sacrificed 12 weeks after the last injection and tumors were counted (30). COX-2 transgenic mice treated with AOM (n=12) developed more tumors compared to wild type littermates (n=20, p<0.05). There was no difference in the saline-treated mice. B. Tumor size distribution. There was a statistically significant shift (p<0.05) towards larger diameter tumors in the AOM-treated transgenic mice compared to AOM-treated wild type littermates. *Indicates statistical significance in the >4mm category: 4 out of the 12 transgenic mice developed tumors larger than 4mm in diameter compared to none in the wild type group (p<0.03). Error bars are standard error of the mean. C. Average tumor volume per mouse was calculated. * Indicates a statistically significant increase in average tumor volume in the AOM-treated transgenic mice compared to AOM-treated wild type littermates (p<0.03). D. Total tumor load per mouse. Tumor sizes for each mouse were summed to reflect both tumor number and average tumor size. *Indicates a statistically significant higher tumor load in the AOM-treated transgenic mice compared to AOM-treated wild type littermates (p<0.03). E. Representative methylene blue-stained colons (left) and hematoxylin-stained tissue sections (right) from AOM-treated wild type and COX-2 transgenic mice.

