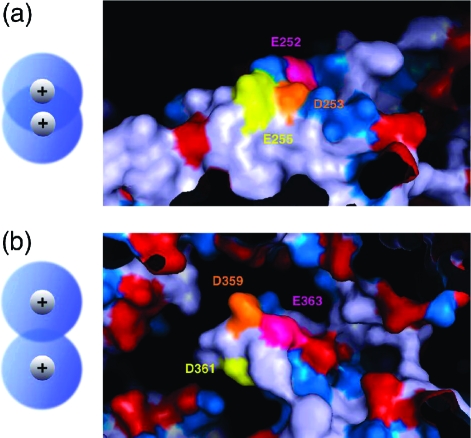
Figure 2.
Surface maps of the crystal structure of GroEL+ES are colored by residue. The three residues altered in the mutants D253K, QNQ, D253N, and KKK1 (a) and in D359K, D359N, NNQ, and KKK2 (b) are colored in orange, pink, and yellow. Charged residues are colored in red for negative and blue for positive. To the left, a schematic illustrates the greater overlap of hydration spheres for charged residues arranged closer together in space.

