Figure 5.
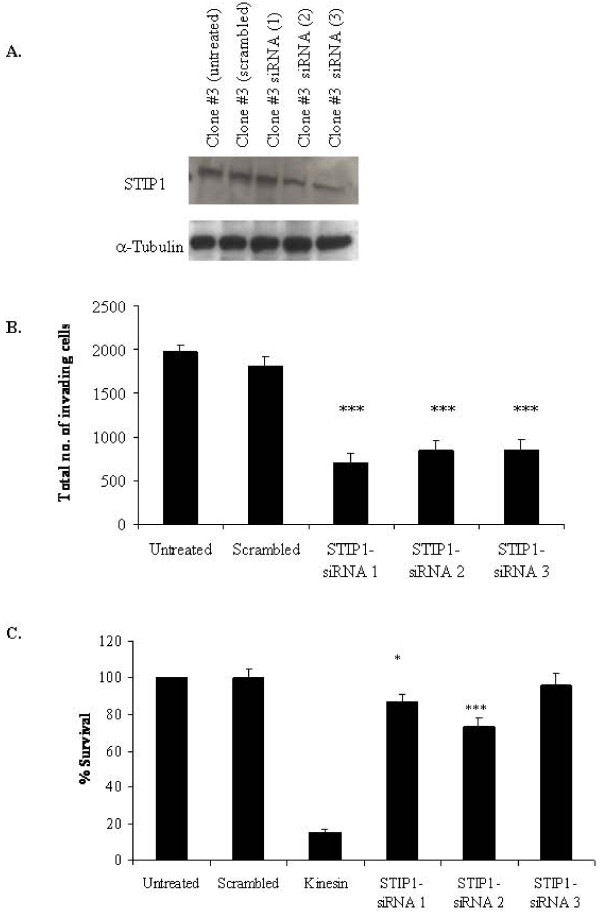
A. Immunoblot of STIP1 silencing in Clone #3 cells untreated control, scrambled control, STIP1-siRNA (1), STIP1-siRNA (2) and STIP1-siRNA (3) (upper) and α-tubulin as loading control (lower). B. Total number of invading cells after siRNA transfection in Clone #3 untreated control, scrambled control, STIP1-siRNA (1), STIP1-siRNA (2) and STIP1-siRNA (3). Results are displayed as the total number of invading cells, determined by counting the number of cells per field in 10 random fields, at 200× magnification. The average number of cells per field was then multiplied by a factor of 140 (growth area of membrane/field area viewed at 200× magnification (calibrated using a microscope graticule)). Experiments performed in triplicate. Total mean number of cells invading at 200× magnification (n = 3). C. Proliferation assays of Clone #3 untreated control, scrambled control, STIP1-siRNA (1), STIP1-siRNA (2) and STIP1-siRNA (3). Results displayed as percentage survival relative to untreated control. Student's t-test; p = 0.05*, 0.01**, 0.005*** (n = 3).

