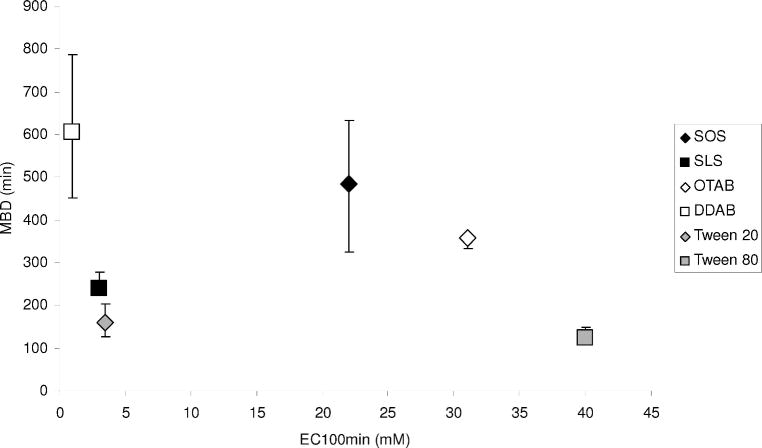
Figure 4.
Maximum block duration (MBD) plotted against interpolated EC100min values for each CPE indicate no correlation (R2 = 0.08). Anionic, cationic, and nonionic surfactants are grouped by color (black, grey, and white, respectively). Block durations are expressed as medians with 25th and 75th percentiles (n ≥ 4; see Methods).

