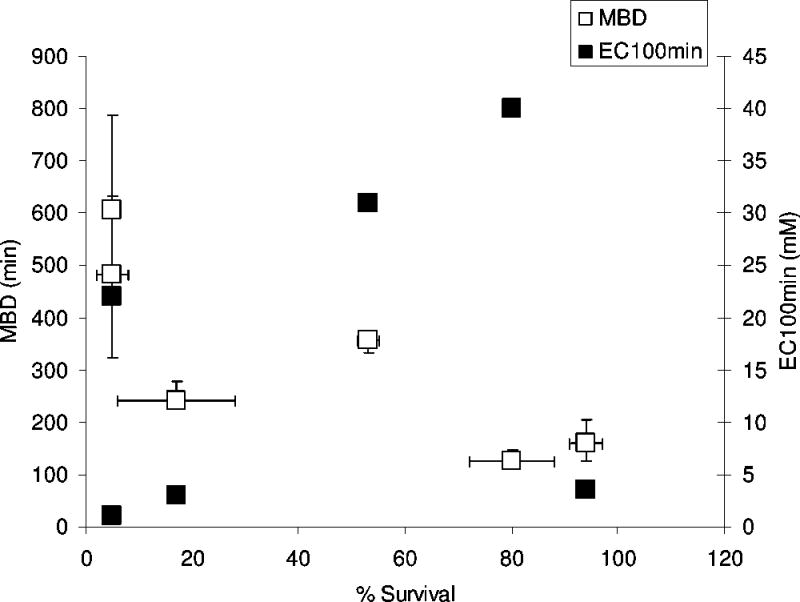
Figure 5.

Maximum block duration (MBD) and EC100min plotted against cell survival. The EC50eff is the CPE concentration that caused a half-maximal increase in block duration. Cell survival data are means with standard deviations from C2C12 cells exposed to each CPE at its EC50eff for 2 hours from Figure 2). Block durations are expressed as medians with 25th and 75th percentiles.
