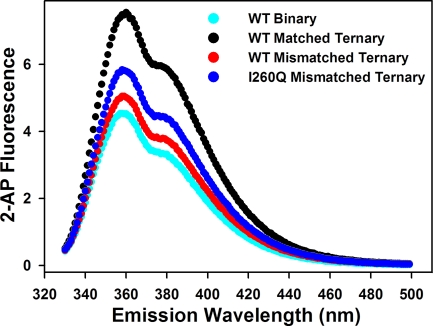
Figure 10.
Steady-state fluorescence spectra of matched and mismatched ternary complexes for WT Pol β and I260Q. Reactions contained 200 nM 19dd/36AP(T)/15 DNA, 500 nM enzyme in the presence of either no dNTP, 300 μM matched dNTP, or 5 mM mismatched dNTP in Pol β assay buffer at pH 8.5. Emission spectra shown include WT binary complex (cyan), WT T:A matched ternary complex (black), WT T:G mismatched ternary complex (red), I260Q T:G mismatched ternary complex (blue). Omitted for simplification are the I260Q binary and T:A matched ternary complexes, which overlay accurately with the corresponding WT traces.

