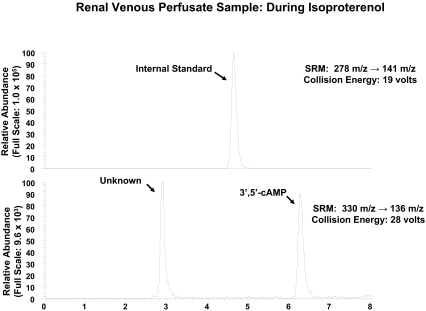
Fig. 2.
Figure illustrates a chromatogram of renal venous perfusate obtained from the same kidney as in Fig. 1 but during the administration of isoproterenol (1 μM). Two transitions were monitored: 278 → 141 m/z for the internal standard (top), which was 13C10-adenosine; and 330 → 136 m/z for endogenous 3′,5′-cAMP (bottom). Comparing with Fig. 1, note the marked increase in the area of the peak corresponding to 3′,5′-cAMP (6.3 min), whereas the area of the unknown peak (2.9 min) was little changed.

