
Figure 2.
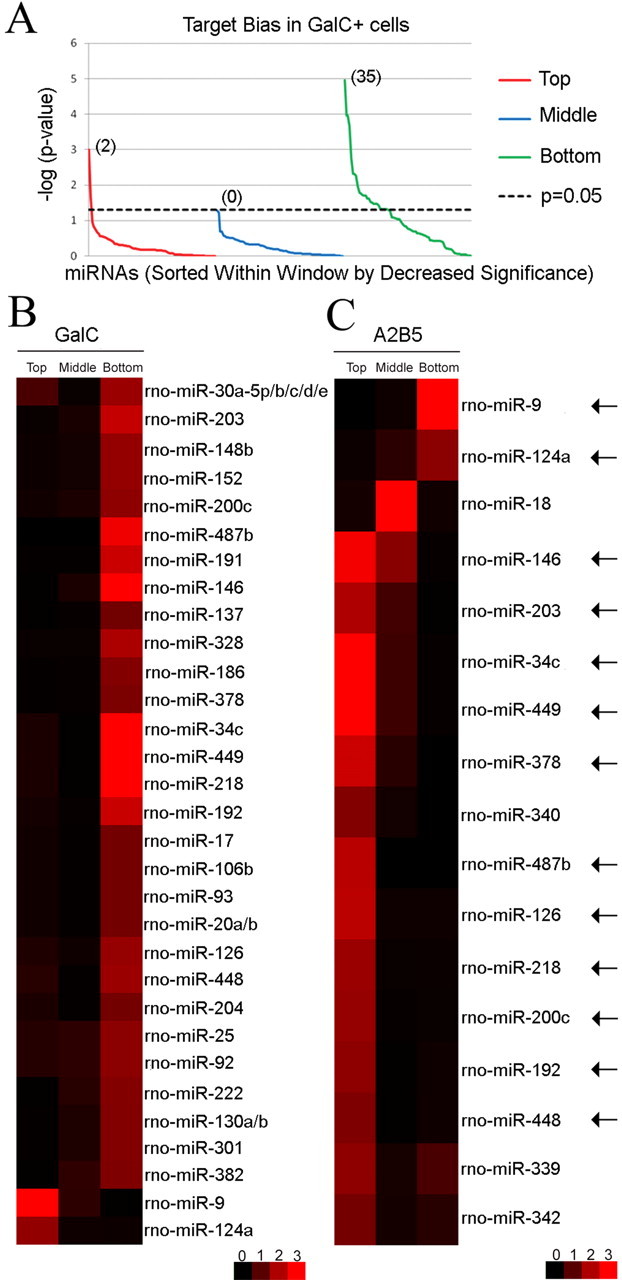
Target bias reversal of a subset of miRNAs during oligodendrocyte differentiation. A, Target bias analysis in A2B5− GalC+ cells. The p values are calculated in three windows (top tenth, middle tenth, and bottom tenth percentile windows) of the GalC rank order list, log-transformed, and depicted by line chart. For each window, the 98 miRNAs are sorted by decrease level of significance. Thirty-seven of 98 miRNAs are associated with a target bias. Notably, a negative target bias is predominant (35 miRNAs in the green line above 1.3, corresponding to p < 0.05, right-tailed Fisher's exact test), whereas only two miRNAs are found with a positive target bias (red line above the 1.3 value). As a negative control, the middle window does not contain any target bias (blue line below 1.3 for all 98 miRNAs). B, Targeting bias in A2B5− GalC+ cells. The heat map shows the significance values calculated for 37 miRNAs with target bias within each window (top, middle, bottom). As in A, the p values depicted are generated using a −log (p value) transformation. Red denotes target bias in the considered window, whereas black is used for no statistical difference. From the heat map display, 35 of 37 miRNAs show a negative target bias. Only miR-9 and miR-124a are associated with a positive target bias in OLs and are located at the bottom of the heat map. C, Targeting bias in A2B5+ GalC− cells. The analysis reveals that 17 of 98 miRNAs show a target bias in A2B5+ GalC− cells. Interestingly, the target bias analysis of 13 miRNAs (indicated by arrows) shows a coordinated reversal in the distribution of predicted targets during oligodendrocyte differentiation (from the top A2B5+ GalC− window to the bottom A2B5− GalC+ window for 11 miRNAs and from the bottom A2B5+ GalC− window to the top A2B5− GalC+ window for 2 miRNAs). miR-9 and miR-124a, whose distribution bias of predicted targets switches from negative to positive correlation signatures, are located on the top of the heat map.